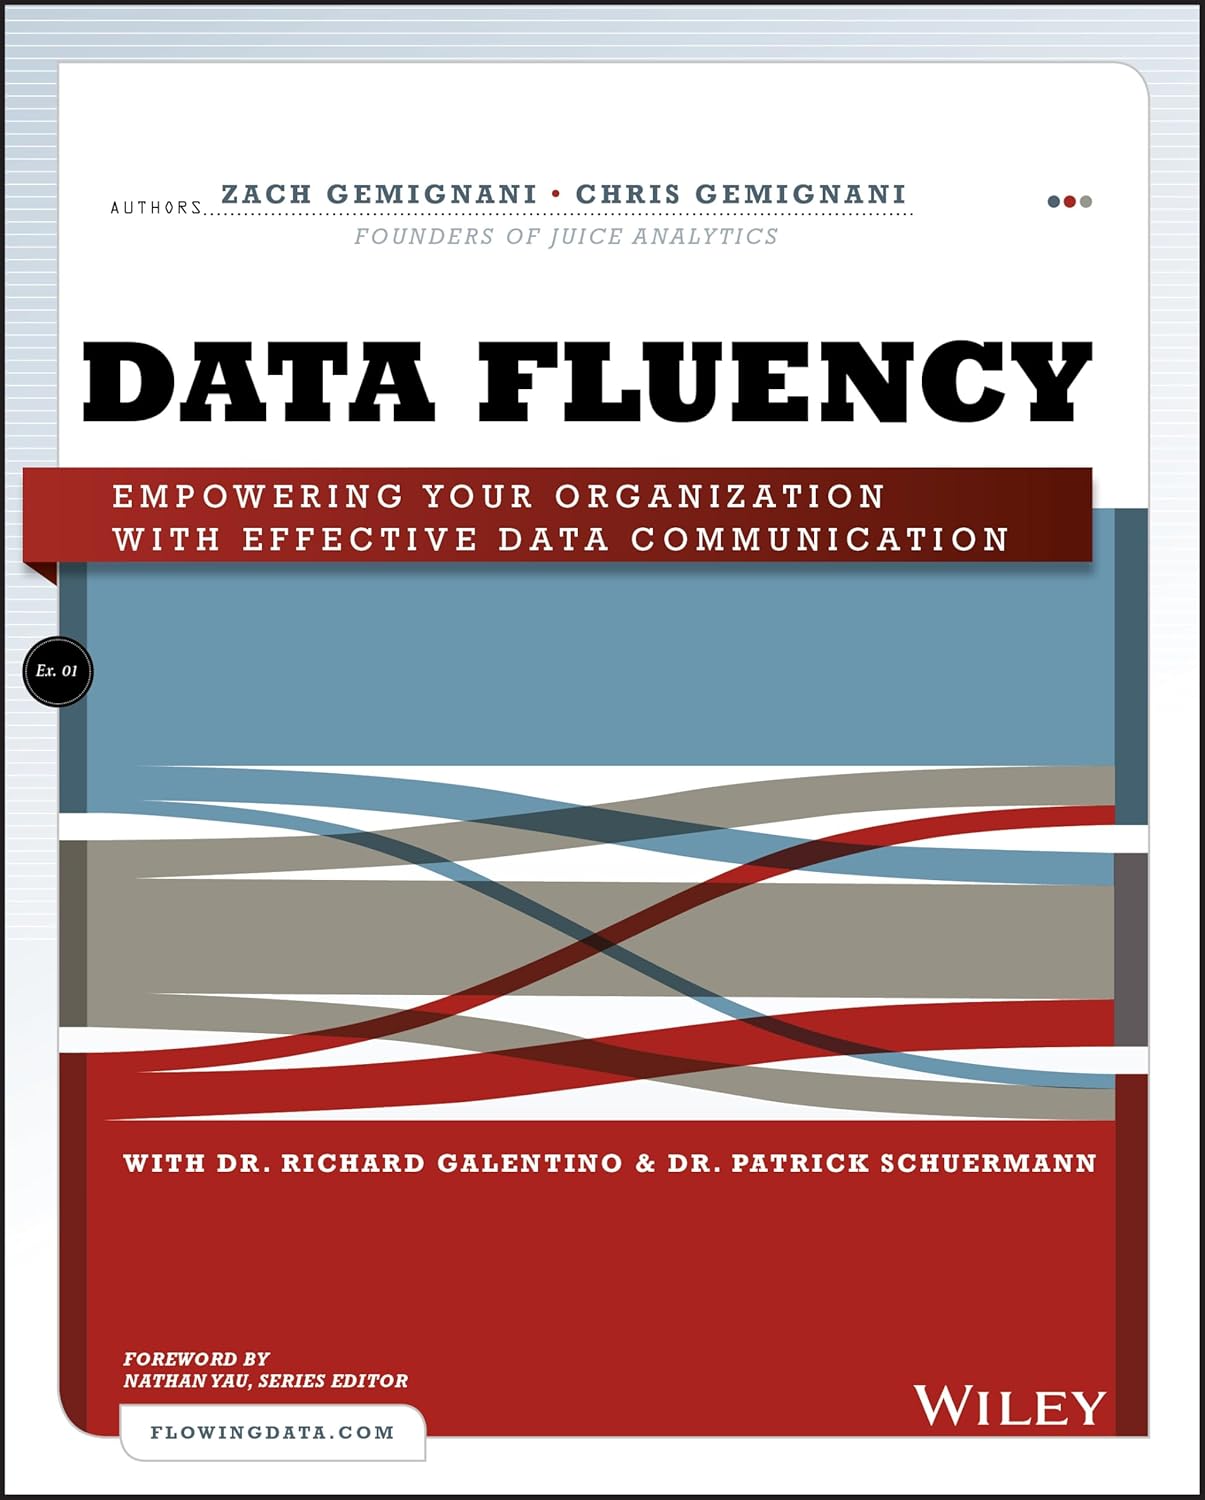
Data Fluency is about building an organizational culture that promotes good communication with data. Written by Zach Gemignani and Chris Gemignani, founders of Juice Analytics, the book reads as if it’s a peek into the author’s approach in how they consult and counsel their clients though the use of their Data Fluency Framework. Readers get a view into how different roles, from data analyst to report consumers to organizational leaders, play an important part in creating and promoting a data fluent organization. The book then takes, in my opinion, a 20,000 foot view of how choosing the right KPIs and metrics, choosing data tools, employing data visualization best practices, and designing data products with clear context are all key parts of an organization becoming data fluent. My opinion is probably largely influenced by the fact that most of my data career has been as a practitioner who likes to get in the weeds on each of these topics. In the author’s defense, though, I don’t think getting in the weeds is necessary in this book. An ideal audience for Data Fluency are leaders or executives who are interested in creating a more data driven, data fluent culture.
What I Learned
The points that made the largest impression on me in this book were not necessarily new points. But the authors used different language (to me) to describe points that are already well spread in the data community. The book is 10 years old after all. But sometimes hearing the same thing in a different way drives the point home.
“Communicating with data is less often about telling a specific story and more like starting a guided conversation. It is a dialogue with the audience rather than a monologue.” (page 83)
“The creator of a data product is closer to a “guide” – laying out a path for the audience to travel along, but the findings and conclusions are more fluid. The landscape may always be changing.” (page 95)
The term “guided conversation” makes a lot of sense to me. I am not opposed to data storytelling, or the techniques used to implement data storytelling, but I have had a hard time feeling like I have fully implemented data storytelling techniques when delivering dashboard style reporting. Many times it’s because the data story is not crystal clear, or that a report will be looked at through different lenses thereby potentially altering the data story – such as monitoring key metrics sliced by different divisions of a company. Viewing myself as the guide, pointing out the key insights that are found in the data, rather than viewing myself as a storyteller makes my job feel more clear. I find it easier to ask myself, “how am I guiding report consumers through this report?” rather than, “how am I telling a story with this data?” while designing reports. Or while doing exploratory analysis, I find it easier to draw a map between the key findings rather than trying to outline a story no matter the data product deliverable format.
Throughout the book, the authors encourage using data to spark conversations and that data presentations should be discussions that lead to action. I like this emphasis on discussion. Since getting my data legs under me, I have felt that presenting data through conversation has yielded the best results. In my experience, understanding has come more quickly through discussion, particularly verbal discussion, for both the report author and the data consumer. The most fruitful questions have come during data presentation meetings or the sidebar conversations sparked by those meetings. And engaging those questions in a conversational format has typically led to taking action more quickly. I’m not saying that emailing reports or viewing a dashboard through a web browser is ineffective or useless. But the conversation has been more one way than two way. If delivering data via those channels, a meeting or discussion of some sort should come out of it. Those discussions don’t have to be limited to verbal discussion in meetings. Discussion could take place in Teams or Slack. Whatever medium is appropriate and effective for the organization. The point is that data should not be held in a silo, it should be available and open in the context of the organization.
In Closing
As someone who has been a data practitioner and is in transition into more leadership roles, I’m glad that I read this book. While Data Fluency has some good nuggets, this probably wouldn’t be the right choice for a data practitioner. For data practitioners, I would recommend you select a book that dives deeper into data visualization, data storytelling, or a specific skill that you’re looking to grow in. Perhaps one of my other book reviews may be a good start for you. Happy reading!


